Figure 2B
Compute for given shape parameter \(\alpha\) the scale parameter \(\beta\) such that the overall connection probability such that the overall connection probability equals \(\mu=0.1\).
This is done for 500 pairs and will take several minutes to complete. The result is saved in data/.
from gamma_functions import *

import numpy as np
from scipy.optimize import brentq
import scipy.integrate as integrate

# mu = \int_0^1 x f_ab(x) dx
# Given mu,a what is b?


def root_f(b):

    return integrate.quad(lambda x: x*fT(x,a,b),0,1)[0] - mu


mu = 0.1

a_ns = []
b_ns = []

for a in np.logspace(np.log10(0.2),np.log10(98),500):

    a_ns.append(a)

    b = brentq(root_f, 0.5*mu/a, 5*mu/a)

    b_ns.append(b)

    print a, " ", b


np.save("data/a_ns.npy", a_ns)
np.save("data/b_ns.npy", b_ns)
To plot the graphic
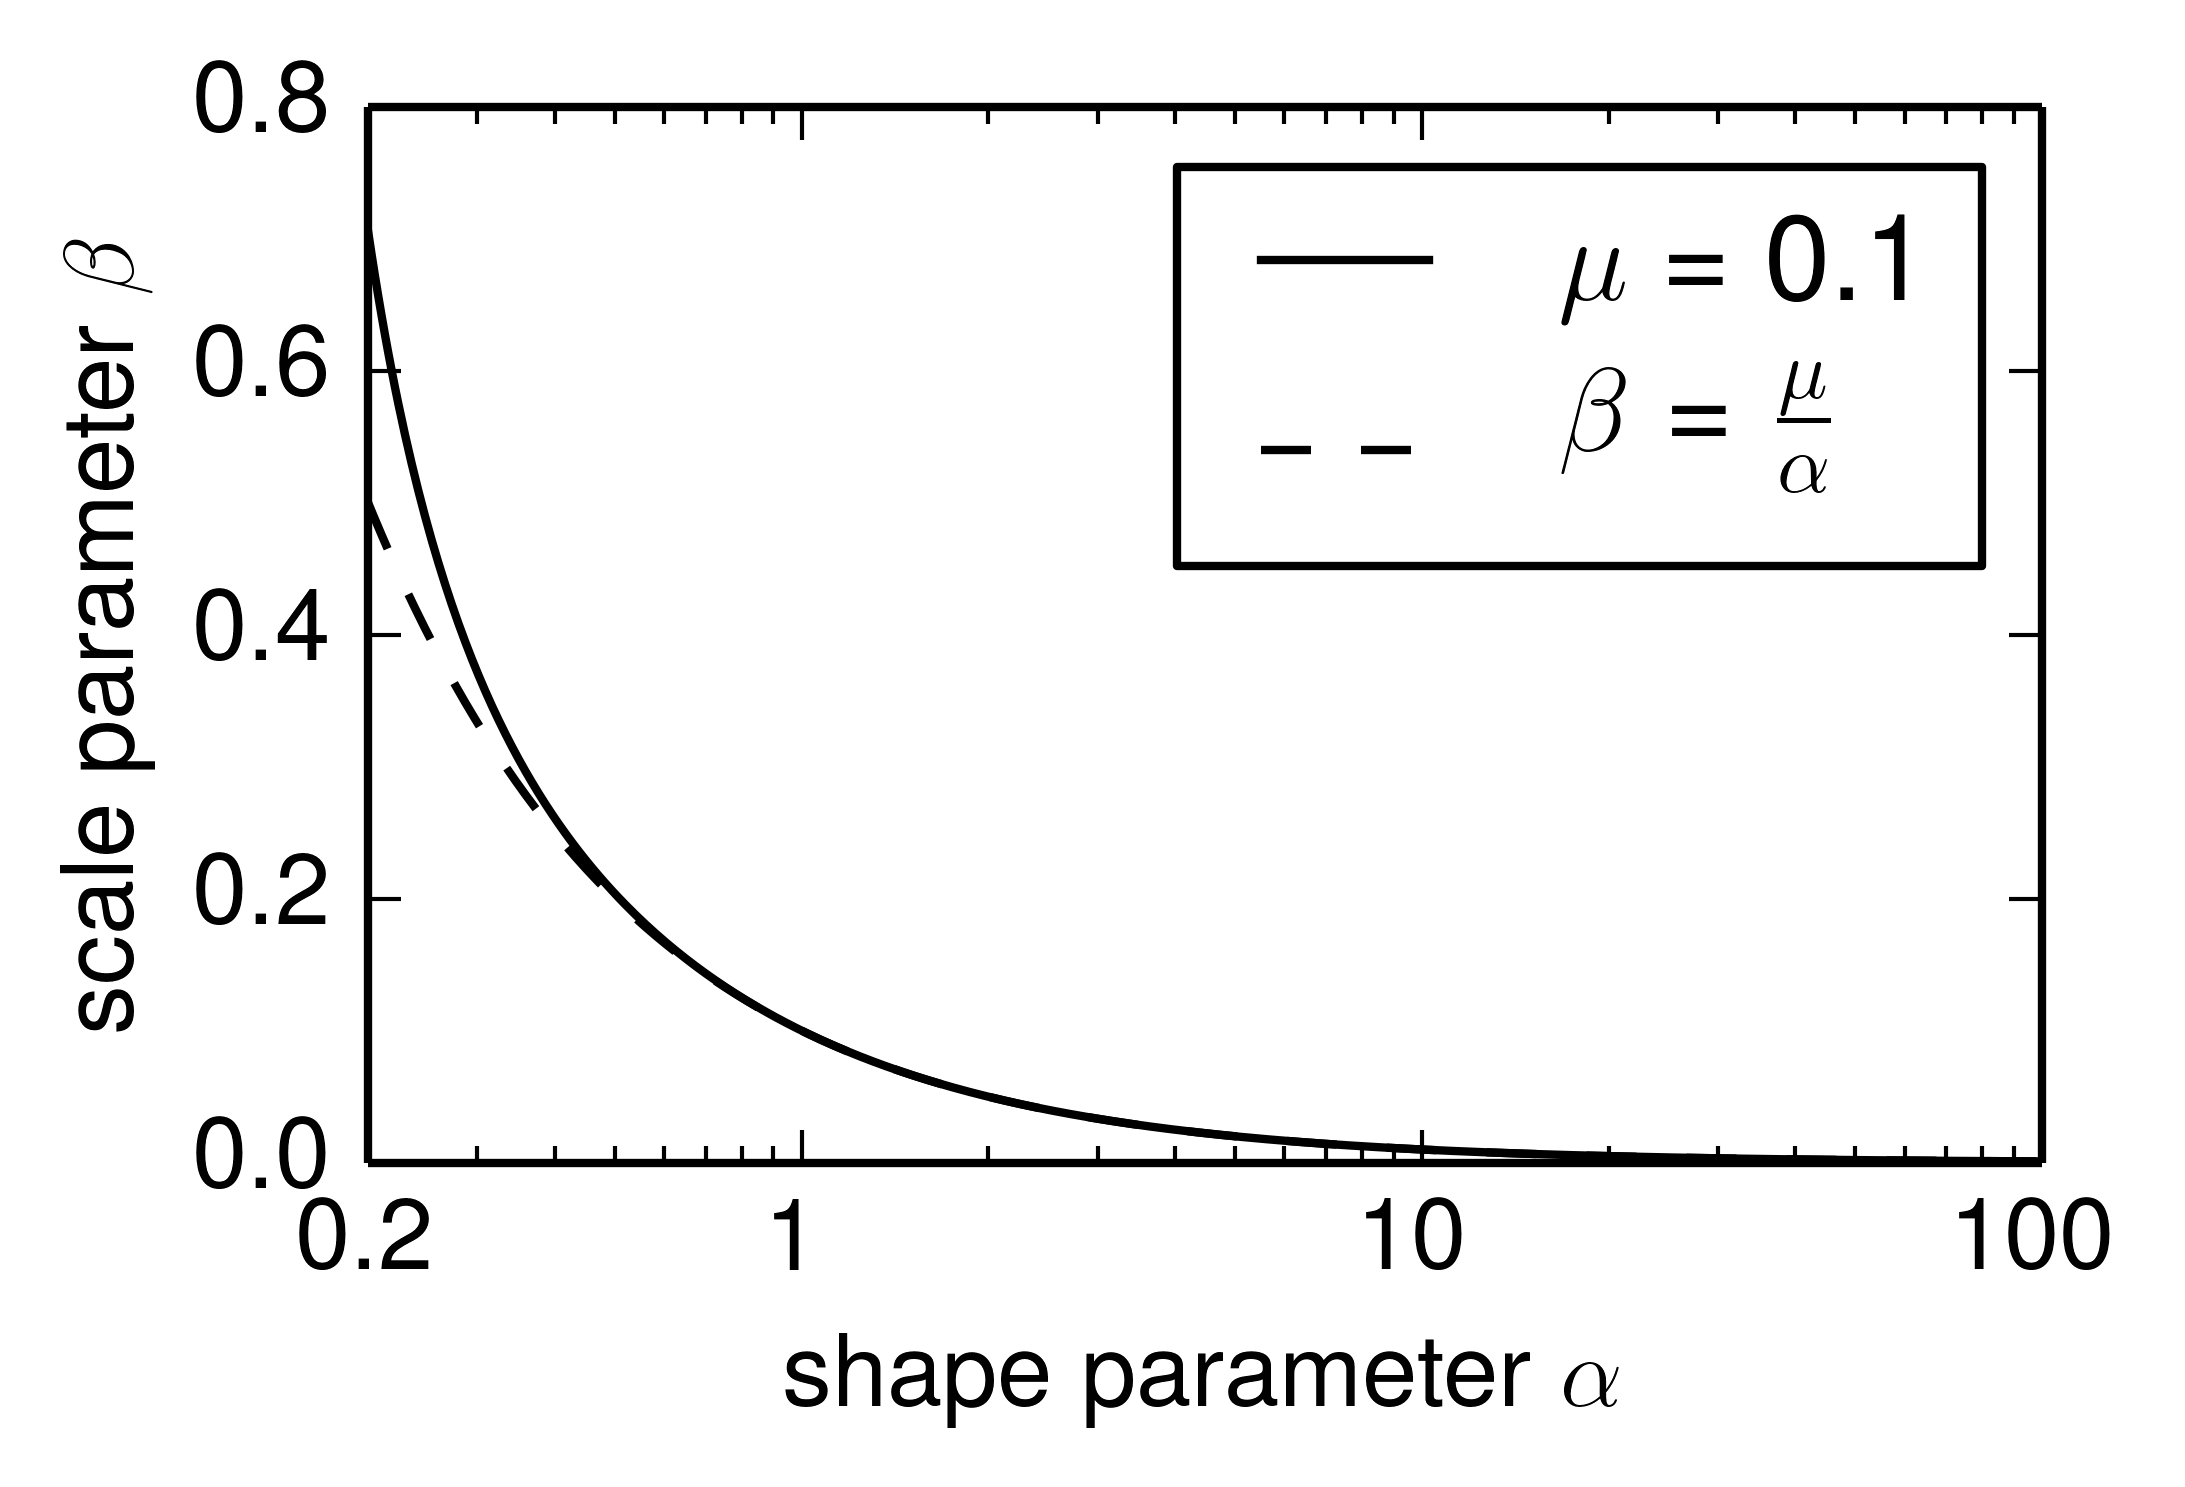
the saved lists for \(\alpha\) and \(\beta\) are loaded and \(\alpha\) is plotted versus \(\beta\) and, for comparison, versus \(\frac{\mu}{\alpha}\).
import pylab as pl
import numpy as np

from scipy.stats import gamma

import matplotlib.ticker as ticker
from matplotlib import rc

rc('text', usetex=True)
pl.rcParams['text.latex.preamble'] = [
    r'\usepackage{tgheros}',    # helvetica font
    r'\usepackage{sansmath}',   # math-font matching  helvetica
    r'\sansmath'                # actually tell tex to use it!
    r'\usepackage{siunitx}',    # micro symbols
    r'\sisetup{detect-all}',    # force siunitx to use the fonts
]


a_ns = np.load("data/a_ns.npy")
b_ns = np.load("data/b_ns.npy")


fig, ax = pl.subplots(1,1)
fig.set_size_inches(7.2*0.5,2.2)

ax.plot(a_ns, b_ns , color='k', label=r'$\mu=0.1$')
ax.plot(a_ns, [0.1/a for a in a_ns], color='k',
        linestyle='dashed', label=r'$\beta = \frac{\mu}{\alpha}$')


ax.set_xscale('log')

ax.set_xlabel(r'shape parameter $\alpha$')
ax.set_ylabel(r'scale parameter $\beta$')

pl.xticks(sorted(list(pl.xticks()[0]) + [0.2]),
          sorted(['0.2']+[str(int(x)) for x in list(pl.xticks()[0])]))

ax.set_yticks(np.arange(0.,0.9,0.2))
ax.set_xlim(0.2,100)

ax.legend()

pl.savefig('gamma_figB.pdf', dpi=600, bbox_inches='tight')